A long-horizon robot manipulation benchmark for frontier models


A long-horizon robot manipulation benchmark for frontier models
145 tasks · 1 to 10 subgoals per instruction · 3 simulated suites
LADDER is a benchmark of 145 manipulation tasks in which a single instruction asks the robot for 1 to 10 pick-and-place steps. It measures how far today's robot policies, orchestrators and agents get as instructions grow longer, on two robots across three simulators.
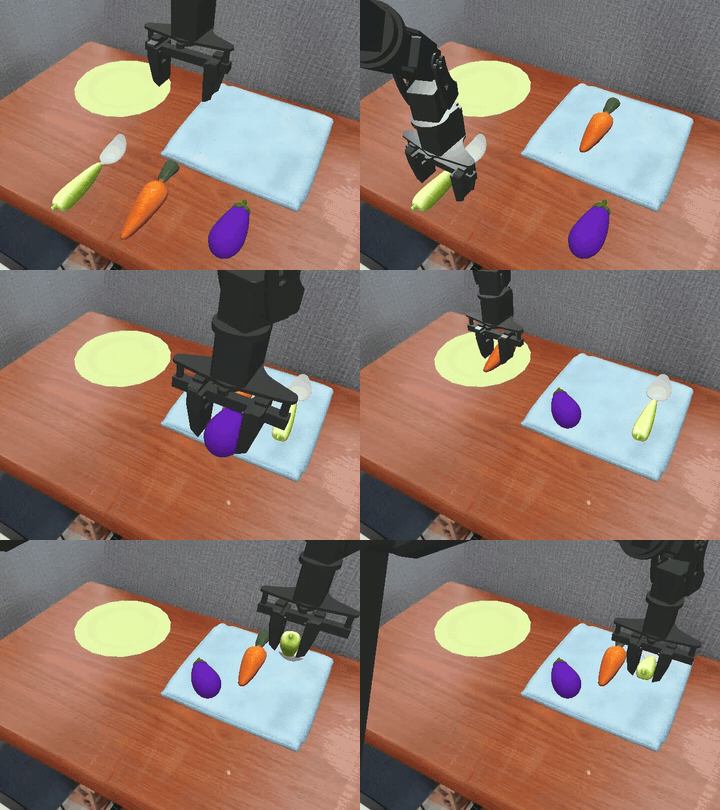 GPT-Policy · 10 subgoals
4× speed
GPT-Policy · 10 subgoals
4× speedSimplerEnv-Long
54 tasks · SAPIEN · WidowX 250
low-level policy: Bridge policy
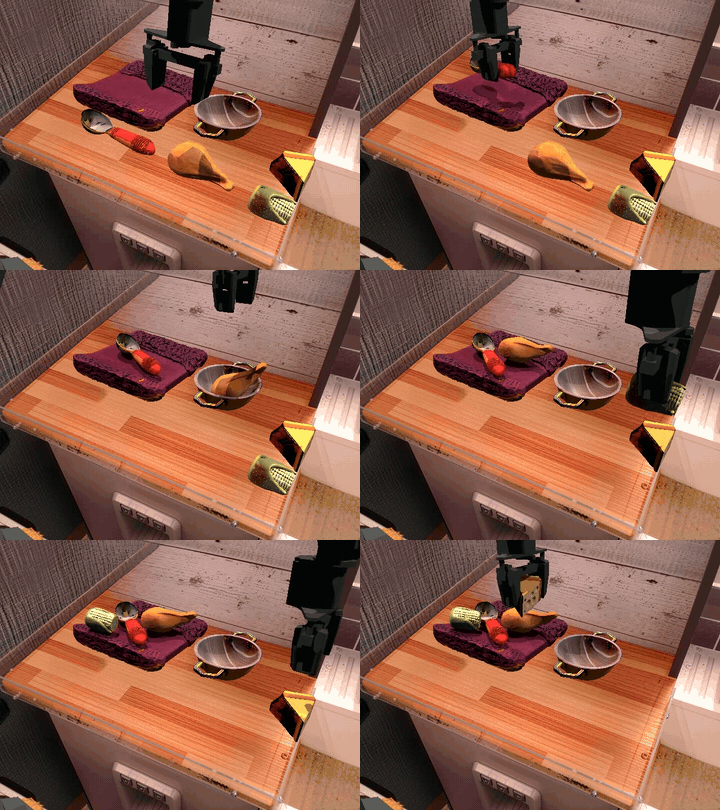 GPT-Policy · 8 subgoals
4× speed
GPT-Policy · 8 subgoals
4× speedRobotArena-∞-Long
47 tasks · Genesis · WidowX 250
low-level policy: Bridge policy
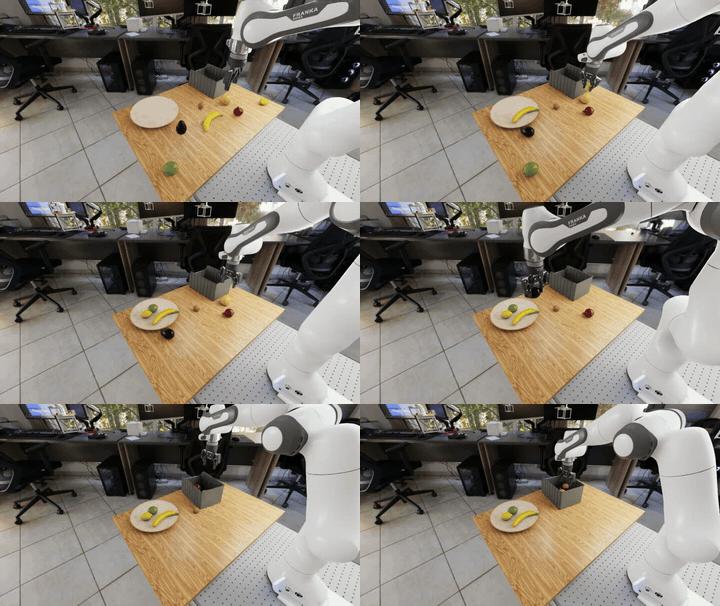 GPT-Policy · 7 subgoals
4× speed
GPT-Policy · 7 subgoals
4× speedRoboLab-Long
44 tasks · Isaac Sim · Franka FR3
low-level policy: π0.5 (DROID)
What one instruction asks for.
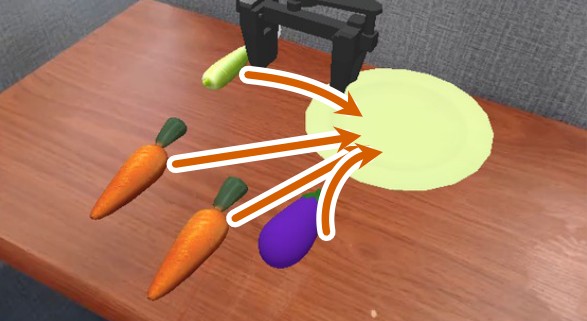
Single destination 44 tasks
Every object goes to the same destination.
“put both carrots, the spoon and the eggplant on the plate”
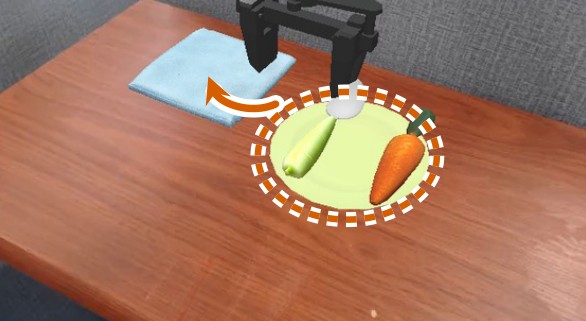
Transfer 8 tasks
Every object starts on one destination and is moved to another.
“move the carrot and the spoon from the plate to the blue towel”
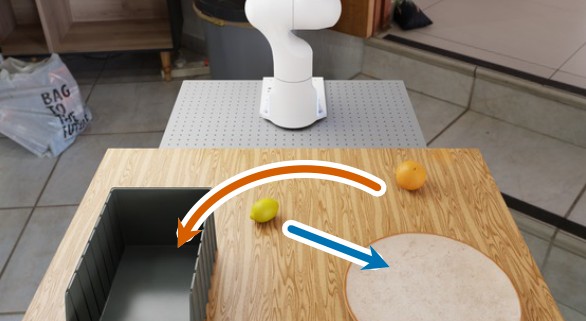
Split destination 25 tasks
Different objects go to different destinations.
“put the lemon on the plate and put the orange in the bin”
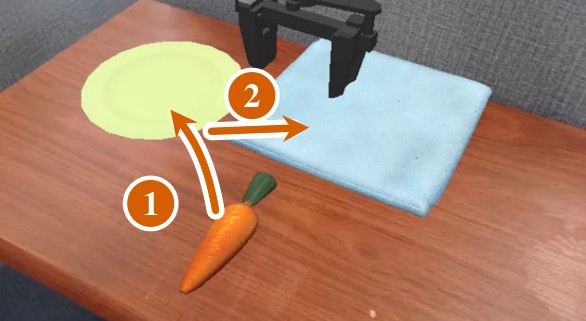
Relay 20 tasks
Objects pass through an intermediate destination.
“first put the carrot on the plate, then put the carrot on the blue towel”
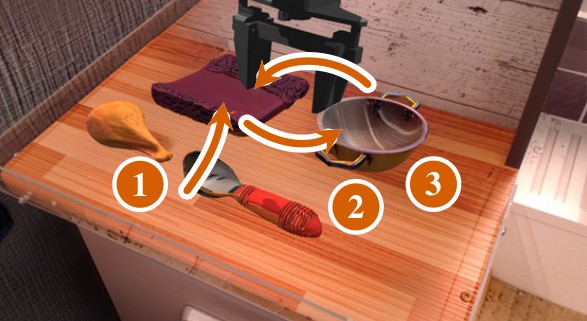
Revisit 13 tasks
Objects return to a destination they have already left.
“first put the spoon on the cloth, then put the spoon in the pot, then put the spoon on the cloth”
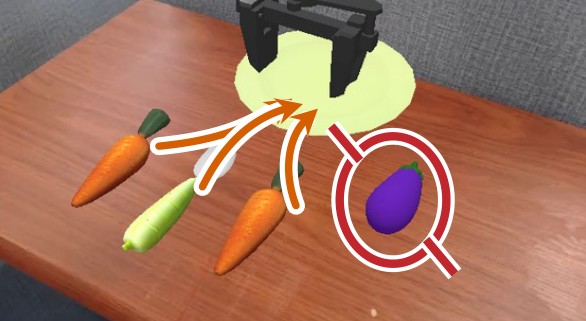
Exclusion 13 tasks
Some objects must be left where they are.
“put everything except the eggplant on the plate”
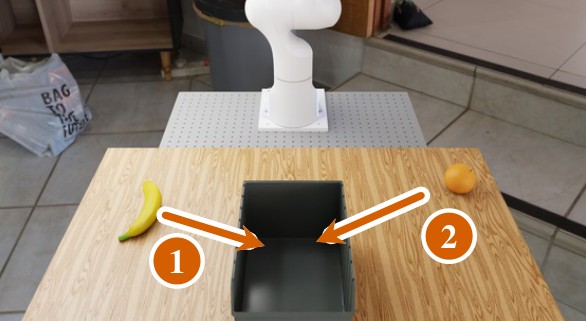
Ordered 14 tasks
The placements must occur in a stated order.
“first put the banana in the bin, then put the orange in the bin”
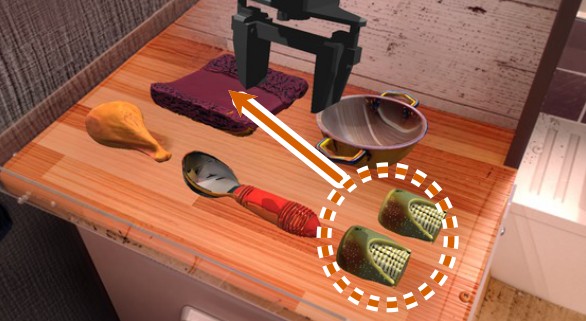
Duplicates 8 tasks
Several identical objects, so the instruction refers to them by count, not by name.
“put both corn cobs on the cloth”
The main findings, in order of importance.
Policies fail on long instructions
Given the full instruction, the low-level policy completes 85.4% of 1-subgoal tasks, 26.9% of 2-subgoal tasks and 0.0% of 5-subgoal tasks.
One subgoal at a time helps
On 2-subgoal tasks, the same policy succeeds 58.4% of the time when an orchestrator gives it one subgoal at a time and checks each one with a VLM.
Orchestrators must check progress
An orchestrator that moves on without checking skips up to 43.4% of subgoals before they are done. Checking with a VLM reduces this to 3.4%.
The best system uses a frontier VLM
GPT-Policy, an agent driven by GPT-6 Astra, completes 62.0% of all episodes, the highest of all systems.
Its success costs 20 times more
GPT-Policy spends $6.49 on API calls per successful episode. PSP-Agent, second at 40.1%, spends $0.33.
Agents hold up on long tasks
On 5-subgoal tasks, PSP-Agent still succeeds 27.3% of the time, more than the privileged verifier with the same low-level policy (11.1%).
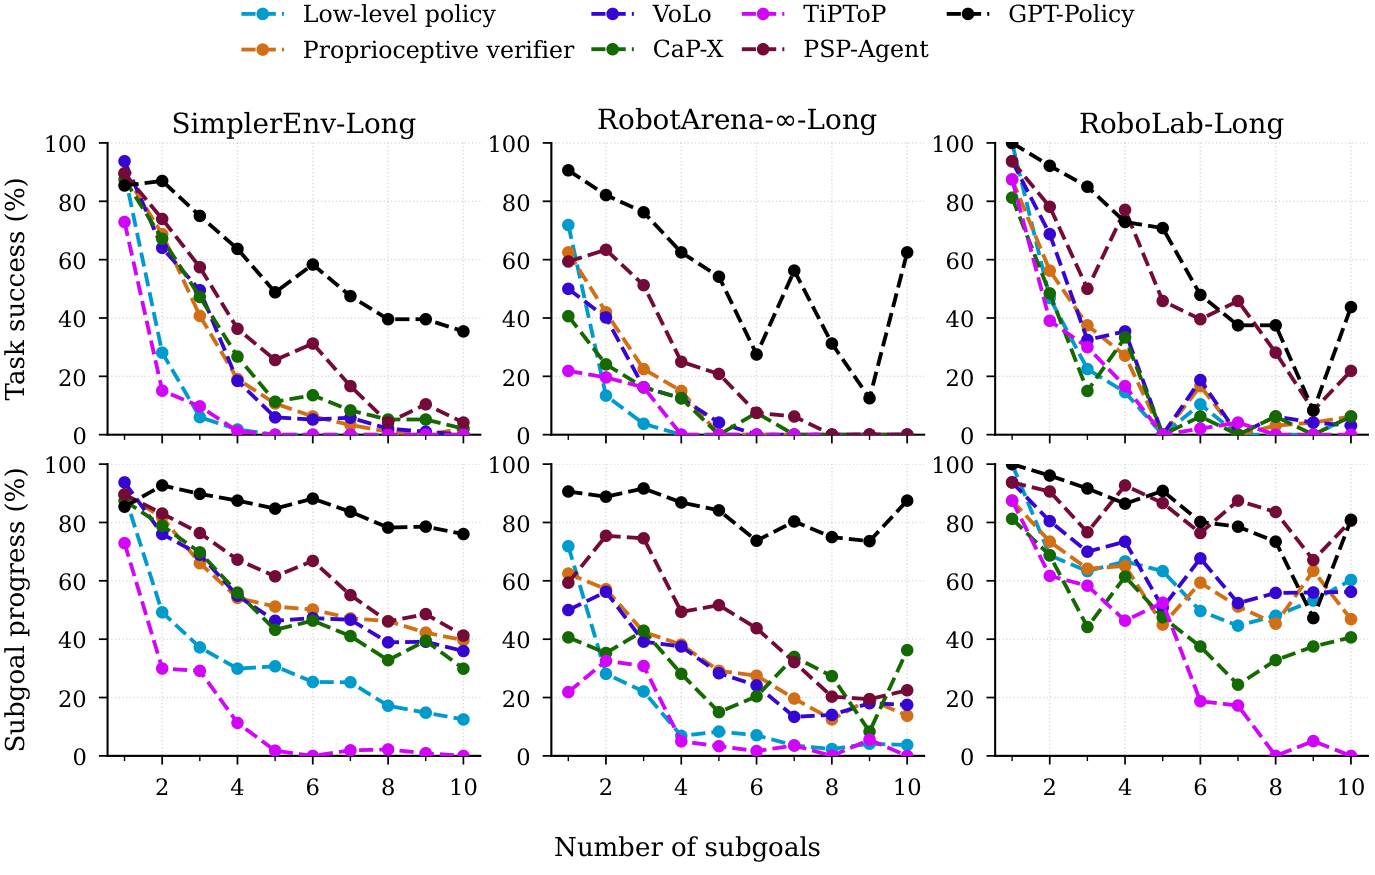
Performance scaling across task horizon. Task success rate (top) and subgoal progress (bottom) as the horizon increases from 1 to 10 subgoals across all three benchmark suites (all ten systems: Tables 11 and 13).
What each system spends on model calls, and how it uses its time.
An agent that calls a frontier model at every step is the most successful system, and by far the most expensive. One full evaluation of GPT-Policy costs up to $8,134 in API calls.
Cost is measured from each provider's own token counts, at list prices. The robot policy runs on a local GPU and is not included.
| System | Model | Model calls per episode | Cost per episode | Cost per success |
|---|---|---|---|---|
| GPT-Policy | GPT-6 Astra | 54 | $4.02 | $6.49 |
| VoLo | Gemini 3.7 Flash | 23 | $0.17 | $0.66 |
| PSP-Agent | Gemini 3.7 Flash | 23 | $0.13 | $0.33 |
| Proprioceptive verifier | Gemini 3.7 Flash | 10 | $0.045 | $0.18 |
| CaP-X | Gemini 3.7 Flash | 5 | $0.043 | $0.17 |
| TiPToP | Gemini 3.7 Flash | 1 | $0.007 | $0.07 |
More time would not help much
The Proprioceptive verifier completes 42.1% of all subgoals in the first half of the time limit, and only 49.5% by the end.
Successful episodes finish early
Successful episodes of the systems built on a low-level policy use 36–45% of the time limit on average.
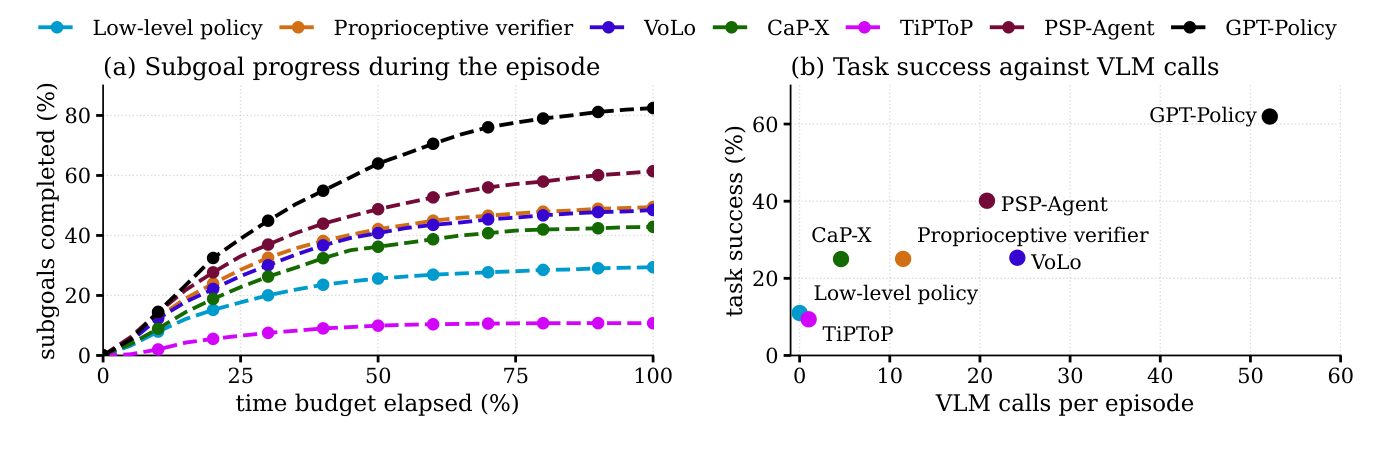
Robot time and compute. (a) Share of all subgoals completed as the simulated time budget elapses. (b) Task success against VLM calls per episode. Both combine all suites (per suite: Table 15; tokens and API cost: Appendix G).
| Low-level policy | Periodic trigger | Proprioceptive trigger | Proprioceptive verifier | VoLo | CaP-X | TiPToP | PSP-Agent | GPT-Policy | Privileged verifier | |
|---|---|---|---|---|---|---|---|---|---|---|
| VLM calls per episode | ||||||||||
| SimplerEnv-Long | 0.0 | 0.0 | 0.0 | 12.7 | 24.8 | 3.8 | 1.0 | 18.0 | 50.1 | 0.0 |
| RobotArena-∞-Long | 0.0 | 0.0 | 0.0 | 9.3 | 26.4 | 5.6 | 1.0 | 20.2 | 41.7 | 0.0 |
| RoboLab-Long | 0.0 | 0.0 | 0.0 | 9.3 | 19.2 | 6.3 | 1.0 | 31.8 | 70.8 | 0.0 |
| VLM calls per completed subgoal | ||||||||||
| SimplerEnv-Long | 0.0 | 0.0 | 0.0 | 4.9 | 10.1 | 1.6 | 2.8 | 6.1 | 11.8 | 0.0 |
| RobotArena-∞-Long | 0.0 | 0.0 | 0.0 | 7.3 | 22.2 | 5.1 | 2.1 | 10.7 | 13.3 | 0.0 |
| RoboLab-Long | 0.0 | 0.0 | 0.0 | 3.2 | 6.0 | 2.9 | 0.9 | 7.5 | 17.4 | 0.0 |
| Input tokens per episode (thousands) | ||||||||||
| SimplerEnv-Long | 0.0 | 0.0 | 0.0 | 17.2 | 70.5 | 7.5 | 2.0 | 27.3 | 357.8 | 0.0 |
| RobotArena-∞-Long | 0.0 | 0.0 | 0.0 | 12.6 | 75.0 | 12.9 | 2.0 | 31.2 | 293.5 | 0.0 |
| RoboLab-Long | 0.0 | 0.0 | 0.0 | 23.6 | 91.6 | 15.3 | 2.1 | 48.5 | 508.8 | 0.0 |
| Generated tokens per episode (thousands) | ||||||||||
| SimplerEnv-Long | 0.0 | 0.0 | 0.0 | 2.7 | 7.4 | 3.1 | 0.5 | 10.4 | 5.7 | 0.0 |
| RobotArena-∞-Long | 0.0 | 0.0 | 0.0 | 1.8 | 6.6 | 4.6 | 0.4 | 10.1 | 4.9 | 0.0 |
| RoboLab-Long | 0.0 | 0.0 | 0.0 | 2.5 | 7.2 | 5.1 | 0.4 | 16.4 | 8.3 | 0.0 |
| API cost per episode (USD) | ||||||||||
| SimplerEnv-Long | 0.000 | 0.000 | 0.000 | 0.046 | 0.161 | 0.034 | 0.007 | 0.119 | 3.861 | 0.000 |
| RobotArena-∞-Long | 0.000 | 0.000 | 0.000 | 0.032 | 0.162 | 0.054 | 0.006 | 0.123 | 3.177 | 0.000 |
| RoboLab-Long | 0.000 | 0.000 | 0.000 | 0.054 | 0.191 | 0.061 | 0.006 | 0.196 | 5.501 | 0.000 |
| API cost per successful episode (USD) | ||||||||||
| SimplerEnv-Long | 0.00 | 0.00 | 0.00 | 0.18 | 0.63 | 0.12 | 0.10 | 0.32 | 6.40 | 0.00 |
| RobotArena-∞-Long | 0.00 | 0.00 | 0.00 | 0.13 | 0.76 | 0.33 | 0.05 | 0.31 | 4.76 | 0.00 |
| RoboLab-Long | 0.00 | 0.00 | 0.00 | 0.21 | 0.66 | 0.30 | 0.04 | 0.38 | 8.76 | 0.00 |
| Subgoals completed by half of the time budget (%) | ||||||||||
| SimplerEnv-Long | 21.3 | 37.8 | 42.3 | 44.1 | 40.3 | 38.4 | 6.0 | 42.9 | 60.9 | 47.8 |
| RobotArena-∞-Long | 10.5 | 25.4 | 24.4 | 24.6 | 26.7 | 19.4 | 12.6 | 37.9 | 60.2 | 24.4 |
| RoboLab-Long | 53.1 | 52.6 | 50.2 | 48.4 | 53.6 | 41.6 | 22.3 | 78.4 | 78.1 | 55.9 |
| Subgoals completed by the end of the budget (%) | ||||||||||
| SimplerEnv-Long | 25.3 | 39.9 | 45.8 | 51.0 | 48.3 | 45.9 | 7.1 | 58.2 | 83.3 | 52.4 |
| RobotArena-∞-Long | 13.5 | 28.3 | 28.9 | 33.7 | 31.8 | 29.5 | 12.6 | 50.2 | 83.4 | 32.7 |
| RoboLab-Long | 56.6 | 57.1 | 58.9 | 56.1 | 62.0 | 42.4 | 22.4 | 81.6 | 78.7 | 63.3 |
API cost at list prices; it covers only the hosted VLM.
Does the ranking in simulation hold on physical robots?
WidowX 250 and Franka FR3
The low-level policy alone, the Proprioceptive verifier and PSP-Agent on tasks of 1 to 5 subgoals, 12 episodes per task and system.
Simulation predicts the real ranking
On the physical robots the three systems rank in the same order as in simulation.
| Task category | Subgoals | Low-level policy | Prop. verifier | PSP-Agent |
|---|---|---|---|---|
| WidowX | ||||
| Single destination | 1 | 66.7 | 75.0 | 100.0 |
| Single destination | 2–3 | 0.0 | 33.3 | 87.5 |
| Split destination | 2–3 | 0.0 | 29.2 | 83.3 |
| Exclusion | 2 | 0.0 | 58.3 | 91.7 |
| Ordered | 2 | 8.3 | 33.3 | 41.7 |
| Duplicates | 2 | 0.0 | 0.0 | 58.3 |
| Franka | ||||
| Single destination | 5 | 0.0 | 8.3 | 25.0 |
| Exclusion | 2 | 0.0 | 83.3 | 100.0 |
| Ordered | 3 | 16.7 | 83.3 | 100.0 |
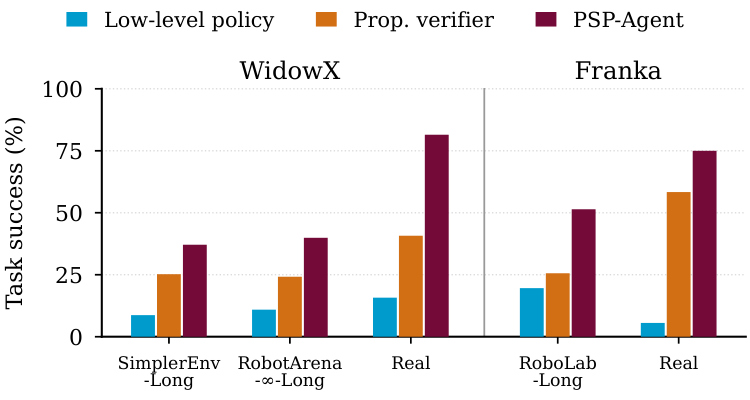
Real-robot evaluation. Left: task success (%) on the real robots per task category, 12 episodes per task and system. Right: overall task success in simulation (Table 3) and on the real robots. Both rank the three systems the same.
The three systems on the same tasks, 12 episodes each. Each clip is typical for its system on that task: a success if the system succeeds in at least half of its episodes, otherwise a failure that completed its median number of subgoals. Speeds are relative to the control rate (5 Hz WidowX, 15 Hz Franka); the real control loop ran somewhat slower than that.
“put both the eggplant and the cup on the cloth and put the carrot in the pot”
“put everything in the pot”
“put everything except the eggplant in the pot”
“put both the eggplant and the cup on the cloth and put the carrot in the pot”
“put everything in the pot”
“put everything except the eggplant in the pot”
“put both the eggplant and the cup on the cloth and put the carrot in the pot”
“put everything in the pot”
“put everything except the eggplant in the pot”
“Put the corn, the carrot, the eggplant, the blue cup and the banana in the bowl”
“First put the blue cup in the bowl, then put the carrot in the bowl, then put the eggplant in the bowl”
“Put everything except the eggplant in the bowl”
“Put the corn, the carrot, the eggplant, the blue cup and the banana in the bowl”
“First put the blue cup in the bowl, then put the carrot in the bowl, then put the eggplant in the bowl”
“Put everything except the eggplant in the bowl”
“Put the corn, the carrot, the eggplant, the blue cup and the banana in the bowl”
“First put the blue cup in the bowl, then put the carrot in the bowl, then put the eggplant in the bowl”
“Put everything except the eggplant in the bowl”
Why subgoals fail, and whether the orchestrator or the policy caused it.
With checking, the policy causes most failures
Only 7.1% of the Proprioceptive verifier's subgoals fail because of an orchestrator decision (13.8% for VoLo). Most failed subgoals never reach the target object.
Failed episodes stop making progress
Half of the failed episodes complete no further subgoal after the first 28% of the time limit.
Agents also report success too early
PSP-Agent marks 16.2% of its subgoals as done when they are not, and TiPToP finds no plan for 50.9% of its subgoals.
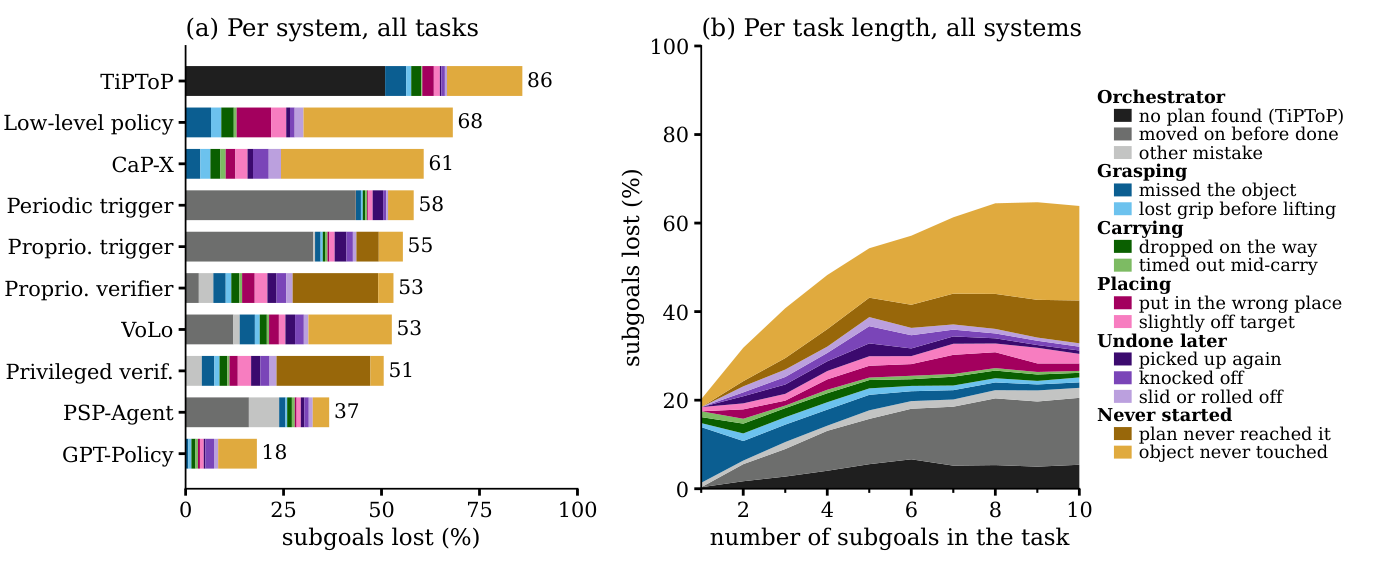
Why subgoals fail. Share of subgoals not completed at the end of the episode, by cause (Appendix H). A loss that an orchestrator decision made final is drawn as an orchestrator cause (grey; CaP-X and GPT-Policy log no decisions), every other loss by what happened to the object. (a) One bar per system, over all its episodes. (b) One point per task length, over all ten systems. Every value is computed within each suite and then averaged over the three suites (per suite: Figure 8).
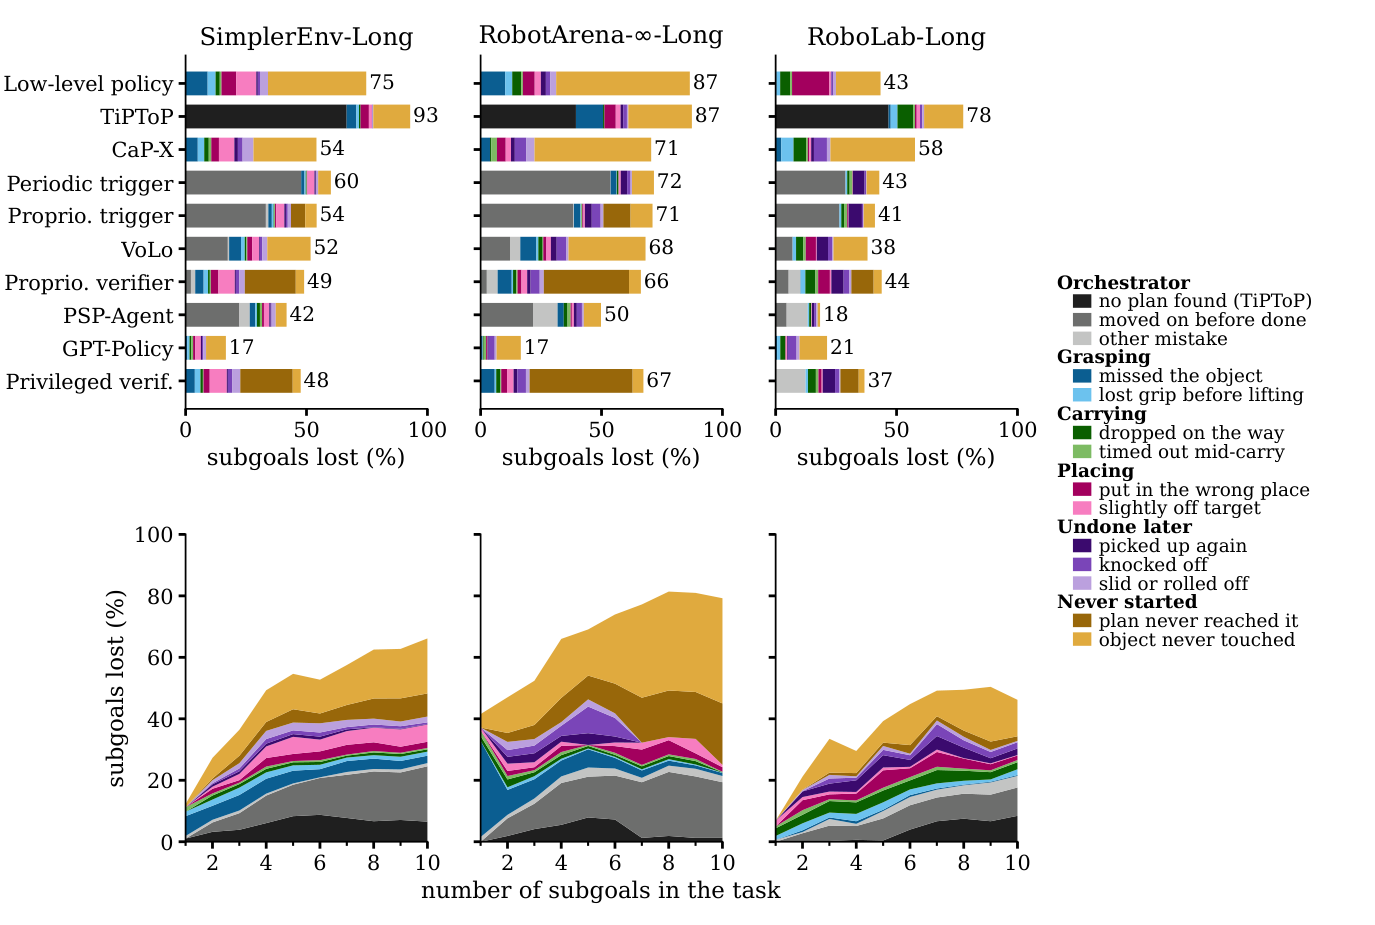
Why subgoals fail, per benchmark. Share of each suite's subgoals not completed, split by cause. Top: one bar per system, over all tasks of the suite. Bottom: all ten systems together, by number of subgoals in the task; on RobotArena-∞-Long each length from 7 up rests on one or two tasks. Systems keep the same order in every panel.
Each model answers the questions an orchestrator asks, on 145 scenes and 562 labelled images, without running the robot. Gemini 3.7 Flash, used by the orchestrators above, has the best mean score (80.8%).
| Model | Planning exact match | Completion TP rate | Completion TN rate | State tracking all correct | Next subgoal valid | Tokens per query |
|---|---|---|---|---|---|---|
| Qwen3-VL-2B | 75.2 ±7.6 | 68.2 ±7.0 | 34.1 ±5.9 | 9.3 ±4.0 | 58.9 ±5.3 | – |
| Qwen3-VL-8B | 91.0 ±5.8 | 69.0 ±6.8 | 79.9 ±5.7 | 47.9 ±5.5 | 72.3 ±4.4 | – |
| Qwen3.5-9B | 86.9 ±6.5 | 44.4 ±6.3 | 96.9 ±2.5 | 11.7 ±3.7 | 63.2 ±4.8 | 5,173 |
| Qwen3.8-27B | 91.0 ±5.8 | 76.2 ±6.3 | 84.8 ±4.3 | 58.2 ±4.8 | 79.3 ±4.1 | 1,904 |
| Gemini 3.1 Pro | 89.7 ±6.0 | 54.8 ±6.6 | 96.0 ±2.9 | 68.7 ±4.3 | 75.2 ±4.5 | 583 |
| Gemini 3.7 Flash | 93.1 ±5.4 | 59.4 ±6.6 | 96.6 ±2.6 | 70.8 ±4.0 | 81.4 ±4.2 | 412 |
| Gemini Robotics-ER 2 | 90.3 ±5.9 | 54.0 ±6.5 | 97.8 ±2.3 | 69.6 ±4.2 | 76.6 ±4.1 | 510 |
| GPT-5.6 Sol | 93.1 ±5.4 | 72.8 ±6.3 | 86.4 ±4.3 | 56.4 ±4.7 | 82.0 ±4.3 | 282 |
| GPT-6 Astra | 91.7 ±5.7 | 71.1 ±6.2 | 86.4 ±4.4 | 53.2 ±5.1 | 85.4 ±4.0 | 203 |
| Claude Opus 5 | 90.3 ±5.9 | 68.6 ±6.6 | 87.9 ±4.1 | 61.0 ±4.7 | 79.8 ±4.4 | 400 |
Scores in % with 95% intervals. Planning: the list of subgoals is exactly right. Completion: finished (TP) and unfinished (TN) subgoals judged correctly. State tracking: the status of every subgoal is right. Next subgoal: the proposed next step is valid.
Episodes from the released evaluation. The label on each video gives its playback speed.
54 tasks · SAPIEN · WidowX 250 · low-level policy: Bridge policy
Highlights: long tasks solved without a single mistake
CaP-X
“first put the carrot on the plate, then put the spoon on the plate, then put the eggplant on the plate, then put the carrot on the blue towel, then put the spoon on the blue towel, then put the eggplant on the blue towel, then put the carrot on the plate, then put the spoon on the plate, then put the eggplant on the plate, then put the carrot on the blue towel”
PSP-Agent
“first put the carrot on the plate, then put the spoon on the plate, then put the eggplant on the plate, then put the carrot on the blue towel, then put the spoon on the blue towel, then put the eggplant on the blue towel, then put the carrot on the plate”
VoLo
“first put the carrot on the plate, then put the carrot on the blue towel, then put the spoon on the plate, then put the spoon on the blue towel, then put the eggplant on the plate, then put the eggplant on the blue towel”
One scene, growing horizon
“put the carrot on the plate”
“put both carrots, both spoons and the eggplant on the plate”
“put the four carrots, the three spoons and the three eggplants on the plate”
“put the carrot on the plate”
“put both carrots, both spoons and the eggplant on the plate”
“put the four carrots, the three spoons and the three eggplants on the plate”
“put the carrot on the plate”
“put both carrots, both spoons and the eggplant on the plate”
“put the four carrots, the three spoons and the three eggplants on the plate”
“put the carrot on the plate”
“put both carrots, both spoons and the eggplant on the plate”
“put the four carrots, the three spoons and the three eggplants on the plate”
“put the carrot on the plate”
“put both carrots, both spoons and the eggplant on the plate”
“put the four carrots, the three spoons and the three eggplants on the plate”
“put the carrot on the plate”
“put both carrots, both spoons and the eggplant on the plate”
“put the four carrots, the three spoons and the three eggplants on the plate”
“put the carrot on the plate”
“put both carrots, both spoons and the eggplant on the plate”
“put the four carrots, the three spoons and the three eggplants on the plate”
“put the carrot on the plate”
“put both carrots, both spoons and the eggplant on the plate”
“put the four carrots, the three spoons and the three eggplants on the plate”
“put the carrot on the plate”
“put both carrots, both spoons and the eggplant on the plate”
“put the four carrots, the three spoons and the three eggplants on the plate”
“put the carrot on the plate”
“put both carrots, both spoons and the eggplant on the plate”
“put the four carrots, the three spoons and the three eggplants on the plate”
Task categories
Proprioceptive verifier
“put both carrots, both spoons and the eggplant on the plate”
Proprioceptive verifier
“first put the carrot on the plate, then put the carrot on the blue towel, then put the spoon on the plate, then put the spoon on the blue towel, then put the eggplant on the plate”
GPT-Policy
“first put the carrot on the plate, then put the spoon on the plate, then put the eggplant on the plate”
47 tasks · Genesis · WidowX 250 · low-level policy: Bridge policy
Highlights: long tasks solved without a single mistake
GPT-Policy
“put the blue bowl, the sushi toy, the cheese, the banana and the mushroom on the purple cloth”
PSP-Agent
“put the blue bowl, the sushi toy, the banana and the cheese on the purple cloth”
VoLo
“put the blue bowl, the sushi toy, the cheese and the banana on the purple cloth”
One scene, growing horizon
“put the blue bowl on the purple cloth”
“put the blue bowl, the sushi toy and the banana on the purple cloth”
“put the blue bowl, the sushi toy, the cheese, the banana, the mushroom and the corn cob on the purple cloth”
“put the blue bowl on the purple cloth”
“put the blue bowl, the sushi toy and the banana on the purple cloth”
“put the blue bowl, the sushi toy, the cheese, the banana, the mushroom and the corn cob on the purple cloth”
“put the blue bowl on the purple cloth”
“put the blue bowl, the sushi toy and the banana on the purple cloth”
“put the blue bowl, the sushi toy, the cheese, the banana, the mushroom and the corn cob on the purple cloth”
“put the blue bowl on the purple cloth”
“put the blue bowl, the sushi toy and the banana on the purple cloth”
“put the blue bowl, the sushi toy, the cheese, the banana, the mushroom and the corn cob on the purple cloth”
“put the blue bowl on the purple cloth”
“put the blue bowl, the sushi toy and the banana on the purple cloth”
“put the blue bowl, the sushi toy, the cheese, the banana, the mushroom and the corn cob on the purple cloth”
“put the blue bowl on the purple cloth”
“put the blue bowl, the sushi toy and the banana on the purple cloth”
“put the blue bowl, the sushi toy, the cheese, the banana, the mushroom and the corn cob on the purple cloth”
“put the blue bowl on the purple cloth”
“put the blue bowl, the sushi toy and the banana on the purple cloth”
“put the blue bowl, the sushi toy, the cheese, the banana, the mushroom and the corn cob on the purple cloth”
“put the blue bowl on the purple cloth”
“put the blue bowl, the sushi toy and the banana on the purple cloth”
“put the blue bowl, the sushi toy, the cheese, the banana, the mushroom and the corn cob on the purple cloth”
“put the blue bowl on the purple cloth”
“put the blue bowl, the sushi toy and the banana on the purple cloth”
“put the blue bowl, the sushi toy, the cheese, the banana, the mushroom and the corn cob on the purple cloth”
“put the blue bowl on the purple cloth”
“put the blue bowl, the sushi toy and the banana on the purple cloth”
“put the blue bowl, the sushi toy, the cheese, the banana, the mushroom and the corn cob on the purple cloth”
Task categories
PSP-Agent
“put the spoon and the corn cob on the cloth and put the chicken drumstick in the pot”
GPT-Policy
“first put the spoon on the cloth, then put the spoon in the pot, then put the spoon on the cloth”
GPT-Policy
“put the three corn cobs on the cloth”
44 tasks · Isaac Sim · Franka FR3 · low-level policy: π0.5 (DROID)
Highlights: long tasks solved without a single mistake
CaP-X
“first put the orange in the bin, then put the pumpkin in the bin, then put the lychee in the bin, then put the lemon in the bin, then put the lime in the bin, then put the banana in the bin, then put the onion in the bin, then put the avocado in the bin”
GPT-Policy
“first put the lemon on the plate, then put the lemon in the bin, then put the lime on the plate, then put the lime in the bin, then put the banana on the plate, then put the banana in the bin”
GPT-Policy
“put the avocado, the banana and the lemon on the plate and put the orange, the lime and the onion in the bin”
One scene, growing horizon
“put the banana in the bin”
“put the banana, the orange, the lemon, the lime, the avocado and the onion in the bin”
“put the banana, both oranges, the lemon, the lime, the avocado, the onion, the lychee, the pumpkin and the pomegranate in the bin”
“put the banana in the bin”
“put the banana, the orange, the lemon, the lime, the avocado and the onion in the bin”
“put the banana, both oranges, the lemon, the lime, the avocado, the onion, the lychee, the pumpkin and the pomegranate in the bin”
“put the banana in the bin”
“put the banana, the orange, the lemon, the lime, the avocado and the onion in the bin”
“put the banana, both oranges, the lemon, the lime, the avocado, the onion, the lychee, the pumpkin and the pomegranate in the bin”
“put the banana in the bin”
“put the banana, the orange, the lemon, the lime, the avocado and the onion in the bin”
“put the banana, both oranges, the lemon, the lime, the avocado, the onion, the lychee, the pumpkin and the pomegranate in the bin”
“put the banana in the bin”
“put the banana, the orange, the lemon, the lime, the avocado and the onion in the bin”
“put the banana, both oranges, the lemon, the lime, the avocado, the onion, the lychee, the pumpkin and the pomegranate in the bin”
“put the banana in the bin”
“put the banana, the orange, the lemon, the lime, the avocado and the onion in the bin”
“put the banana, both oranges, the lemon, the lime, the avocado, the onion, the lychee, the pumpkin and the pomegranate in the bin”
“put the banana in the bin”
“put the banana, the orange, the lemon, the lime, the avocado and the onion in the bin”
“put the banana, both oranges, the lemon, the lime, the avocado, the onion, the lychee, the pumpkin and the pomegranate in the bin”
“put the banana in the bin”
“put the banana, the orange, the lemon, the lime, the avocado and the onion in the bin”
“put the banana, both oranges, the lemon, the lime, the avocado, the onion, the lychee, the pumpkin and the pomegranate in the bin”
“put the banana in the bin”
“put the banana, the orange, the lemon, the lime, the avocado and the onion in the bin”
“put the banana, both oranges, the lemon, the lime, the avocado, the onion, the lychee, the pumpkin and the pomegranate in the bin”
“put the banana in the bin”
“put the banana, the orange, the lemon, the lime, the avocado and the onion in the bin”
“put the banana, both oranges, the lemon, the lime, the avocado, the onion, the lychee, the pumpkin and the pomegranate in the bin”
Task categories
Proprioceptive trigger
“move the orange, the lemon and the lime from the plate to the bin”
Privileged verifier
“put everything except the red block and the blue block in the bin”
RoboLab-Long, 4 subgoals: “put the avocado and the banana on the plate and put the orange and the lime in the bin”. Episodes are sampled at random, so failures are shown where they occurred.
Low-level policy
Periodic trigger
Proprioceptive trigger
Proprioceptive verifier
VoLo
CaP-X
TiPToP
PSP-Agent
GPT-Policy
Privileged verifier
Given the whole instruction at once, the low-level policy stalls after the first subgoals. Driven by the Proprioceptive verifier, it completes the task.
Relay · 6 subgoals: “first put the lemon on the plate, then put the lemon in the bin, then put the lime on the plate, then put the lime in the bin, then put the banana on the plate, then put the banana in the bin”
Low-level policy failure
Proprioceptive verifier success
Ordered · 4 subgoals: “first put the orange in the bin, then put the lemon in the bin, then put the lime in the bin, then put the banana in the bin”
Low-level policy failure
Proprioceptive verifier success
Any policy, orchestrator or agent can join the leaderboard. The guides in the repository have every detail.
Everything needed to run the benchmark and reproduce the results.
Citation
@article{ladder2026,
  title   = {{LADDER}: A Long-Horizon Robot Manipulation Benchmark},
  author  = {Petkov, Petko and Albanese, Giuliano and Nikolov, Nikolay and Van Gool, Luc and Tremblay, Jonathan and Paudel, Danda Pani},
  journal = {arXiv preprint arXiv:2610.18053},
  year    = {2026},
  url     = {https://arxiv.org/abs/2610.18053}
}